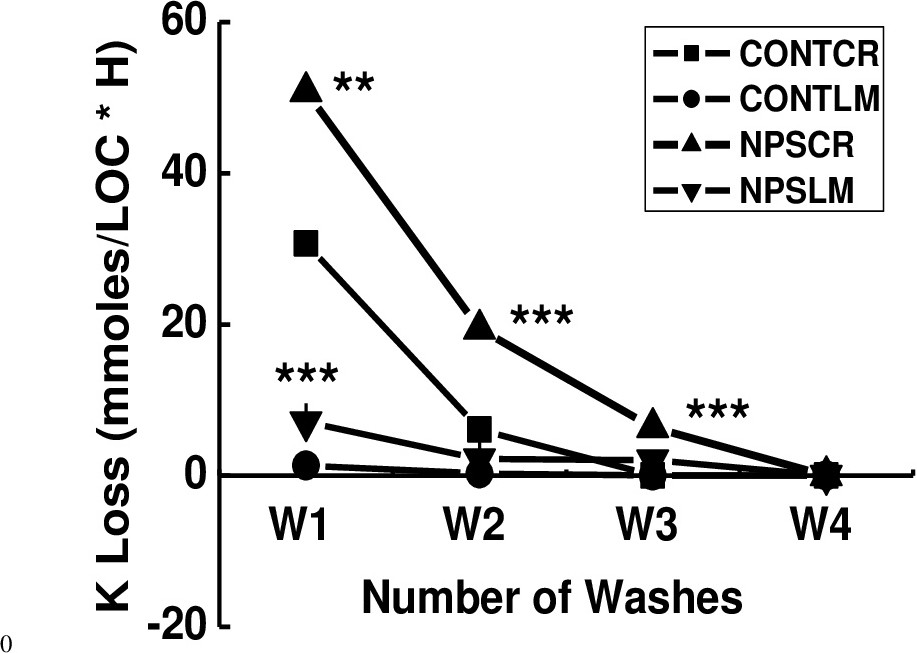
Fig. 11. Effect of AgNPs on K+ loss in human cord blood. The figure represents K+ in supernatants collected from each of the four washes done for CONT and NPs (see Fig. 3. for further details) from RBCs exposed to CR and LM AgNPs and plotted as a function of wash number. K+ was released into the supernatant as a function of wash number according to the following sequence: NPSCR > CONTCR > NPSLM > CONTLM. Values are means ± S.D, n = 3-6. The statistical significance of the difference between NPSCR vs CONTCR and NPSLM vs CONTLM for W1, NPSCR vs CONTCR for W2 and W3 was determined by either paired t- test or two- sample t-test. ** p<0.05; *** p<0.00001.